Talisker Announces Preliminary Economic Assessment for the Bralorne Gold Project Highlighting C$1.0 Billion After-Tax NPV5% and 31.3% IRR at a Base-Case Gold Price of US$3,500/oz; At US$4,300/oz Spot Gold, C$1.9 Billion After-Tax NPV5% and 67.2% IRR
TORONTO, Sept. 21, 2026 (GLOBE NEWSWIRE) -- Talisker Resources Ltd. ("Talisker" or the "Company") (TSX: TSK, OTCQB:
Press Release Disclaimer: This is a press release distributed through the XPR Media network. It has not been independently verified by our newsroom.

TORONTO, Sept. 21, 2026 (GLOBE NEWSWIRE) — Talisker Resources Ltd. (“Talisker” or the “Company”) (TSX: TSK, OTCQB: TSKFF) is pleased to announce the results of an independent Preliminary Economic Assessment (“PEA”) for its Bralorne Gold Project (“Bralorne” or the “Project”) located in British Columbia, Canada. The PEA was prepared in accordance with National Instrument 43-101 – Standards of Disclosure for Mineral Projects (“NI 43-101”) by SGS Geological Services (“SGS”) with contributions from other independent engineering firms.
The Company expects to file the supporting NI 43-101 technical report on SEDAR+ within 45 days of this news release.
Key Highlights
- After-tax NPV5% of C$1,048 million and after-tax IRR of 31.3%, based on a gold price of US$3,500/oz.
- At spot gold price of US$4,300/oz and FX US$:C$ of 0.71 After-tax NPV5% of C$1,876 million and after-tax IRR of 67.2%.
- Average annual production of 110,000 ounces of gold per year (from mill commissioning) over a life of mine of 14 years.
- High-grade Mineral Resource base: The Project hosts Measured and Indicated Mineral Resources of 0.72 Mt grading 8.91 g/t Au for 206,300 oz of contained gold, including 21,900 oz Measured at 10.04 g/t Au and 184,400 oz Indicated at 8.80 g/t Au, together with Inferred Mineral Resources of 11.23 Mt grading 8.73 g/t Au for 3,151,000 oz of contained gold. The PEA is preliminary in nature and relies substantially on Inferred Mineral Resources.
- Initial capital of C$416 million and sustaining capital of C$782 million.
- Average life-of-project head grade of 3.9 g/t Au and average process recovery of 90.6%.
- Average total cash cost of US$1,553/oz and AISC of US$1,914/oz.1
- Nominal average combined processing rate of approximately 2,700 tonnes per day from mill commissioning.
Terry Harbort, CEO of Talisker, commented: “The PEA represents an important milestone for Bralorne and provides a comprehensive view of the Project’s long-term development potential. The study highlights the current operational success while building on the infrastructure, underground access and operating platform already established at site and provides a robust centralized foundation for the building of our district scale vision. Our focus now is to advance from this study and continue de-risking the Project toward the next stage of technical evaluation and permitting.”
The Company will host a webinar on Friday, September 25, 2026, at 12:00 pm ET, during which management will review the results of the PEA outlined in this news release.
Please register here: https://us02web.zoom.us/webinar/register/WN_00fXhqf-SuidsV64YJRx5Q
The webinar livestream replay will also be available after the event: https://bit.ly/adcap-youtube.
Preliminary Economic Assessment Overview
The PEA evaluates a conceptual development scenario for the Bralorne Gold Project based on the current Mineral Resource Estimate with an effective date of June 1, 2026. The assessment considers underground mining utilizing long-hole stoping mining methods and a nominal processing capacity of 2,700 tonnes per day (“tpd”) through a combination of sorting and milling. Once in commercial production the Project would produce on average 110 thousand ounces of gold (“oz”, “AU”) per year with doré smelted on site. Table 1 below presents the key results from the study.
Table 1: Bralorne Gold Project PEA – Key Economic Results (after-tax)
| Metric | Units | Base Case | Spot Case | ||
| Gold price | US$/oz | 3,500 | 4,300 | ||
| Exchange rate | US$:C$ | 0.74 | 0.71 | ||
| NPV5% | C$ million | 1,048 | 1,876 | ||
| IRR | % | 31.3% | 67.2% | ||
| Payback period from commercial production | years | 2.1 | 1.0 | ||
| Average annual fee cash flow1 | C$ million | 132 | 195 | ||
| Average AISC1 | US$/oz | 1,914 | 1,889 | ||
Note:
- All-in sustaining costs per ounce and free cash flow are non-IFRS measures. These measures have no standardized meaning under IFRS and may not be comparable to similar measures used by other issuers. As the Project has not yet achieved commercial production, it does not have historical non-IFRS financial measures nor historical comparable measures under IFRS and therefore these prospective non-IFRS financial measures may not be reconciled to the nearest comparable measure under IFRS.
Table 2: Bralorne Gold Project PEA – Operating and Financial Metrics (after-tax)
| Assumptions | Units | Pre Mill Expansion (2027 – 2030) |
Post Mill Expansion (2031 – 2044) |
Total | |||
| Gold price | US$/oz | 3,500 | |||||
| Exchange rate | USDCAD | 1.35 | |||||
| Discount rate | % | 5% | |||||
| Production | |||||||
| Mine life | Yrs | 4.0 | 13.6 | 17.6 | |||
| Total mineralized material mined | Kt | 1,252 | 13,797 | 15,050 | |||
| Peak annual throughput | Tpd | 1,500 | 2,877 | 2,877 | |||
| Average gold head grade | g/t Au | 5.7 | 3.7 | 3.9 | |||
| Total contained gold | Koz | 230 | 1,653 | 1,883 | |||
| Average gold recovery | % | 93.3% | 90.2% | 90.6% | |||
| Total recovered gold, payable | Koz | 188 | 1,491 | 1,679 | |||
| Average gold production, LOM | koz/yr | 47 | 110 | 95 | |||
| Operating Unit Costs | |||||||
| Underground mining | C$/t mined | 219.5 | 113.7 | 122.5 | |||
| Sorting | C$/t mined | 6.7 | 4.3 | 4.5 | |||
| Processing | C$/t mined | NA | 26.5 | 24.3 | |||
| Water Treatment | C$/t mined | 3.1 | 2.9 | 2.9 | |||
| G&A | C$/t mined | 84.9 | 38.5 | 42.4 | |||
| Total unit operating costs | C$/t mined | 314.3 | 186.0 | 196.7 | |||
| Total operating costs | C$ mm | 394 | 2,566 | 2,960 | |||
| Royalties | C$ mm | 27 | 331 | 358 | |||
| Offsite charges / refining / transport | C$ mm | 197 | 5 | 202 | |||
| Operating Costs | |||||||
| Total cash costs¹ | US$/oz | 2,509 | 1,433 | 1,553 | |||
| All-in sustaining costs (AISC)¹ | US$/oz | 2,957 | 1,782 | 1,914 | |||
| Capital Expenditures | |||||||
| Initial capital | C$ mm | 416 | – | 416 | |||
| Sustaining capital | C$ mm | 114 | 669 | 782 | |||
| Closure costs | C$ mm | – | 35 | 35 | |||
| Total capital expenditures | C$ mm | 530 | 704 | 1,233 | |||
| Economics (After-Tax) | |||||||
| Total free cash flow, LOM¹ | C$ mm | 1,934 | |||||
| Net Present Value (NPV5%) | C$ mm | 1,048 | |||||
| Internal Rate of Return (IRR) | % | 31.3% | |||||
| Payback, from commercial production | Yrs | 2.1 | |||||
| Average free cash flow, LOM1,3 | C$ mm/yr | 171 | |||||
Note:
- Total cash costs, AISC and free cash flow are non-IFRS measures. These measures have no standardized meaning under IFRS and may not be comparable to similar measures used by other issuers. As the Project has not yet achieved commercial production, it does not have historical non-IFRS financial measures nor historical comparable measures under IFRS and therefore these prospective non-IFRS financial measures may not be reconciled to the nearest comparable measure under IFRS.
- Totals may not add due to rounding.
- Calculated from commercial production.
Economic Sensitivity
The PEA base case assumes a gold price of US$3,500/oz and a US$:C$ exchange rate of 1.35. Sensitivities to gold price and other key assumptions are summarized below.
Table 3: Bralorne Gold Project PEA – Economic Sensitivity Analysis, (after-tax)
| Gold Price (US$/oz) |
NPV5% (C$M) |
IRR% | Payback1 (years) |
Average Annual FCF (C$M/year) |
|
| $ | 2,800 | 437 | 15.2% | 4.6 | 113 |
| $ | 3,200 | 787 | 23.9% | 2.9 | 146 |
| $ | 3,500 | 1,048 | 31.3% | 2.1 | 171 |
| $ | 3,900 | 1,395 | 43.1% | 1.5 | 204 |
| $ | 4,300 | 1,741 | 59.4% | 1.1 | 238 |
| $ | 4,700 | 2,086 | 84.3% | 0.7 | 273 |
| $ | 5,100 | 2,430 | 144.7% | 0.4 | 308 |
Notes:
Base case in bold.
- Calculated from commercial production.
Table 4: Bralorne Gold Project PEA – NPV5% Sensitivity Analysis, (after-tax, C$M)
| Gold Price | US$:C$ Exchange Rate | |||||
| (US$/oz) | 1.25 | 1.30 | 1.35 | 1.40 | 1.45 | |
| $ | 2,800 | 258 | 348 | 437 | 526 | 614 |
| $ | 3,200 | 585 | 686 | 787 | 888 | 989 |
| $ | 3,500 | 827 | 938 | 1,048 | 1,158 | 1,268 |
| $ | 3,900 | 1,149 | 1,272 | 1,395 | 1,518 | 1,641 |
| $ | 4,300 | 1,470 | 1,606 | 1,741 | 1,876 | 2,011 |
| $ | 4,700 | 1,790 | 1,938 | 2,086 | 2,233 | 2,381 |
| $ | 5,100 | 2,109 | 2,270 | 2,430 | 2,591 | 2,751 |
Note: Base case in bold.
Table 5: Bralorne Gold Project PEA – IRR Sensitivity Analysis, (after-tax, %)
| Gold Price | US$:C$ Exchange Rate | ||||||||||
| (US$/oz) | 1.25 | 1.30 | 1.35 | 1.40 | 1.45 | ||||||
| $ | 2,800 | 11.0% | 13.1% | 15.2% | 17.2% | 19.3% | |||||
| $ | 3,200 | 18.9% | 21.3% | 23.9% | 26.5% | 29.2% | |||||
| $ | 3,500 | 25.1% | 28.1% | 31.3% | 34.5% | 38.0% | |||||
| $ | 3,900 | 34.7% | 38.7% | 43.1% | 48.1% | 53.6% | |||||
| $ | 4,300 | 46.8% | 52.8% | 59.4% | 67.2% | 76.4% | |||||
| $ | 4,700 | 63.1% | 72.5% | 84.3% | 100.1% | 124.6% | |||||
| $ | 5,100 | 88.3% | 108.2% | 144.7% | 3517.7% | NA | |||||
Note: Base case in bold.
Mineral Resource Estimate
The PEA is based on the Bralorne Gold Project Mineral Resource Estimate (the “2026 MRE”) with an effective date of December 31, 2025. The 2026 MRE comprises Measured and Indicated Mineral Resources of 0.72 million tonnes (“Mt”) grading 8.91 g/t Au for 206,300 ounces of contained gold, together with Inferred Mineral Resources of 11.23 Mt grading 8.73 g/t Au for 3,151,000 ounces of contained gold. The 2026 MRE is reported exclusive of mined-out material and includes 141 mineralized orogenic veins across the Bralorne vein systems.
The 2026 MRE was prepared by Ben Eggers, MAIG, P.Geo., of SGS Geological Services, an independent Qualified Person as defined by NI 43-101, and was peer reviewed by Allan Armitage, Ph.D., P.Geo., of SGS Geological Services, also an independent Qualified Person.
Table 6: Bralorne Gold Project Underground Mineral Resource Estimate, December 31, 2025
| Area | Resource Class | Mass (Mt) |
Average Grade (g/t Au) |
Contained Gold (oz) |
| Mustang | Measured | 0.068 | 10.04 | 21,900 |
| Indicated | 0.333 | 9.49 | 101,700 | |
| M + I | 0.401 | 9.58 | 123,600 | |
| Inferred | 2.404 | 9.32 | 720,300 | |
| Olympus | Indicated | 0.319 | 8.07 | 82,700 |
| Inferred | 8.824 | 8.57 | 2,430,700 | |
| Total | Measured | 0.068 | 10.04 | 21,900 |
| Indicated | 0.652 | 8.80 | 184,400 | |
| M + I | 0.720 | 8.91 | 206,300 | |
| Inferred | 11.228 | 8.73 | 3,151,000 |
Notes:
- The mineral resource was estimated by Ben Eggers, MAIG, P.Geo. of SGS Geological Services, an independent Qualified Person as defined by NI 43-101. Eggers conducted a site visit to the Bralorne Property on January 30-31, 2026. The mineral resource was peer reviewed by Allan Armitage, Ph.D., P.Geo. of SGS Geological Services, an independent Qualified Person as defined by NI 43-101. Armitage conducted a site visit to the Bralorne Property on January 30-31, 2026.
- The classification of the Mineral Resource Estimate (MRE) into Measured, Indicated and Inferred mineral resources is consistent with current 2014 CIM Definition Standards for Mineral Resources and Mineral Reserves. The effective date of the 2006 MRE is December 31, 2025. This is the close out date for the final mineral resource drilling database and the mining depletion models.
- All figures are rounded to reflect the relative accuracy of the estimate and numbers may not add due to rounding.
- All mineral resources are presented undiluted and in situ, constrained by continuous three-dimensional (3D) resource models (considered mineable shapes), and are considered to have reasonable prospects for eventual economic extraction. The mineral resource is exclusive of mined out material.
- Mineral resources are not mineral reserves. Mineral resources which are not mineral reserves, do not have demonstrated economic viability. An Inferred Mineral Resource has a lower level of confidence than that applying to an Indicated or Measured Mineral Resource and must not be converted to a Mineral Reserve. It is reasonably expected that the majority of Inferred Mineral Resources could be upgraded to Indicated or Measured Mineral Resources with continued exploration.
- The 2006 MRE is based on a validated database which includes data from 2,260 surface and underground drillholes totaling 397,759 m completed between 1935 and December 2025 and 38,174 channels totaling 37,944 m completed between 1935 and December 2025. The resource database totals 138,268 assay intervals representing 139,291 m of drillhole data and 40,502 assay intervals representing 37,142 m of channel data.
- The 2006 MRE is based on 141 resource models representing mineralized orogenic veins which comprise the Bralorne vein systems. 3D models of mined out areas with a 5 m buffer applied were used to exclude mined out material from the current 2006 MRE.
- Grades for Au are estimated for each mineralization domain using 1.0 m capped composites assigned to that domain. To generate grade within the blocks, the inverse distance squared (ID2) interpolation method was used for all domains.
- Average density values by deposit area of 2.67 to 2.72 g/cm3 were assigned to all domains based on a database of 509 samples.
- It is envisioned that the Bralorne Gold Project deposits may be mined using underground mining methods. Mineral resources are reported at a base case cut-off grade of 2.3 g/t Au. The mineral resource grade blocks were quantified above the base case cut-off grade, below surface, below overburden, within the constraining mineralization resource models, and exclusive of mined out material.
- The underground base case cut-off grade of 2.3 g/t Au considers metal prices of US$3,200/oz Au and metal recoveries of 93% for Au.
- The underground base case cut-off grade of 2.3 g/t Au considers a mining cost of US$90.00/t rock and a processing, treatment, refining, transportation, and G&A cost of US$47.00/t mineralized material.
- The estimate of mineral resources may be materially affected by environmental, permitting, legal, title, taxation, socio-political, marketing, or other relevant issues.
No Mineral Reserves have been declared for the Project. Mineral Resources that are not Mineral Reserves do not have demonstrated economic viability. The PEA is preliminary in nature and is intended to evaluate the potential economic viability and development options for Bralorne. It is not a Pre-Feasibility Study or Feasibility Study and does not support the declaration of Mineral Reserves.
Mine Design and Planning
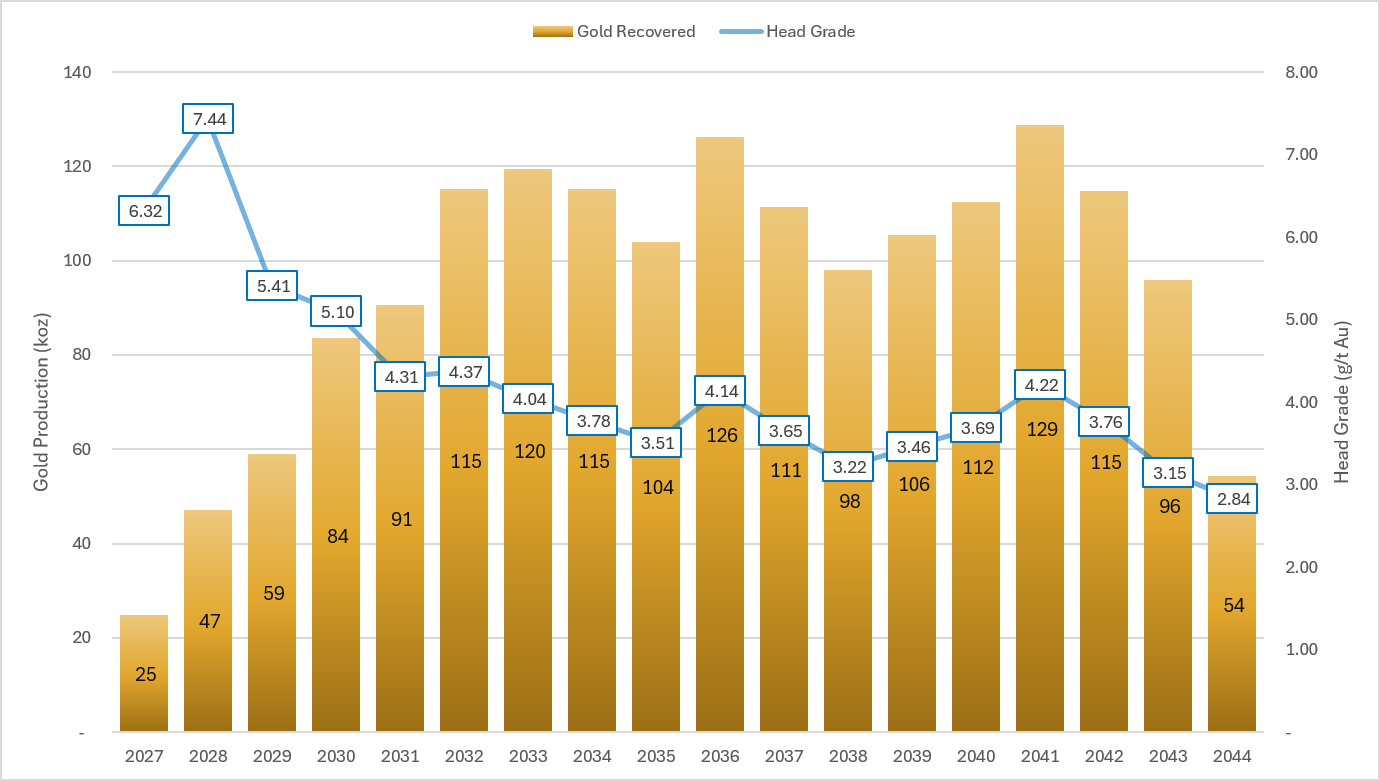
The PEA mine plan includes 15 Mt grading 3.9 g/t Au and containing approximately 1.88 million ounces (“Moz”) of gold separated into three distinct operating centers each with their own ramp and infrastructure systems (See Figure 2). The plan contemplates a gradual ramp up in production during a four year permitting and construction period, during which rates grow from about 350 tpd to 1,500 tpd at the start of mill commissioning. Following the start of commercial production, the mining rate increases up to a maximum of 2,875 tpd for an average of 2,700 tpd over the next 14 years. Figure 1 below shows the recovered gold on a yearly basis along with each year’s head grade.
Figure 1: Gold Recovered and Head Grade Production Profile by Year
Mining will be done by long-hole stoping, longitudinal retreat across the different mineralized veins of the Project. Stope parameters include a minimum width of 2.5 metres (“m”), height from 25 m between levels and a strike length of 20 m for an average stope size of about 3,000 tonnes (“t”).
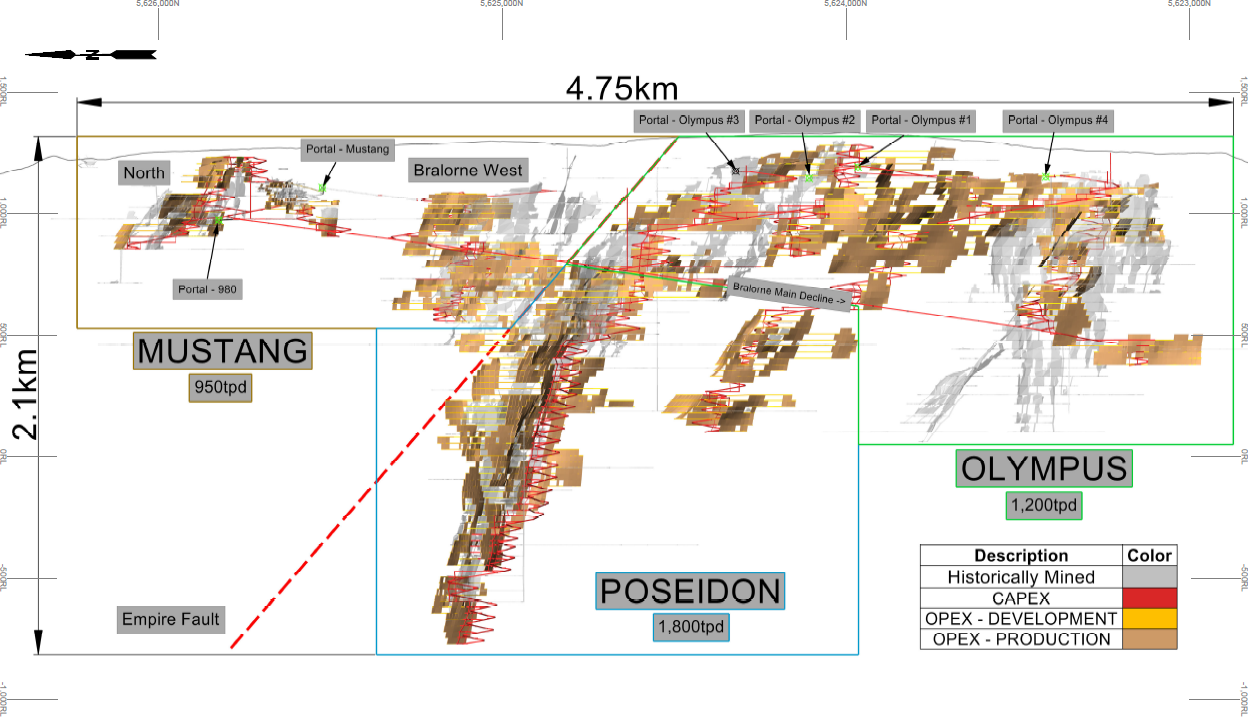
Figure 2: Mine Plan by Production Center – Long Section
Processing and Recovery
The PEA process design is based on the metallurgical tests conducted by ALS and a process trade-off study. The process will include sorting, crushing and grinding, gravity gold recovery, carbon in leach (“CIL”) and downstream ADR circuit. The nominal plant throughput is around 2,400 tpd, including both run of mine (“ROM”) mineralized material and sorting concentrate. The selected primary grind size is 100 micrometre (“um”). Based on the metallurgical test work, the overall gold recovery from the process is expected at 90.6%, with gravity gold recovery of approximately 51% and the remaining gold recovered through CIL and ADR circuit.
Table 7: Bralorne Gold Project – Processing Recoveries
| Cost Area | Units | Pre mill expansion | Post mill expansion | Combined | |||
| Sorting Plant Recovery1 | % | 86.0% | 95.0% | 92.8% | |||
| Sorting Plant Mass Pull1 | % | 35.0% | 60.0% | 56.9% | |||
| Gravity Recovery | % | NA | 51.0% | 51.0% | |||
| CIL | % | NA | 82.0% | 82.0% | |||
| Overall Recovery | % | 93.3% | 90.2% | 90.6% | |||
Note:
- Applied on the coarse particles only, 30% of the material is assumed to be fines and bypass the sorting circuit.
The Project intends to leverage the sorting and crushing plant that Talisker is currently building and set for commissioning next year for the entire life of mine (“LOM”). Once the mill is commissioned, the sorting plant will run at its nominal capacity of 1,700 tpd and receive partial feed from the mining activity, prioritizing lower grade mineralized material in order to increase head grade to the mill and reduce the milling requirements.
Following milling, the tailings will report to a filter plant in proximity to the existing Bralorne Tailing Storage Facility (“TSF”) pond, where they will be filtered and disposed of in a newly built Dry Stack facility upstream of the existing TSF. Once operations are well underway and the maximum production rate is sustained, a paste plant will also be added and tailings will be used as backfill in the lower levels of the mine. From there, the tailings load will be shared between the Dry Stack facility and the underground workings. Figure 3 below provides an overview of the flowsheet for the project once the mill is completed and operational.
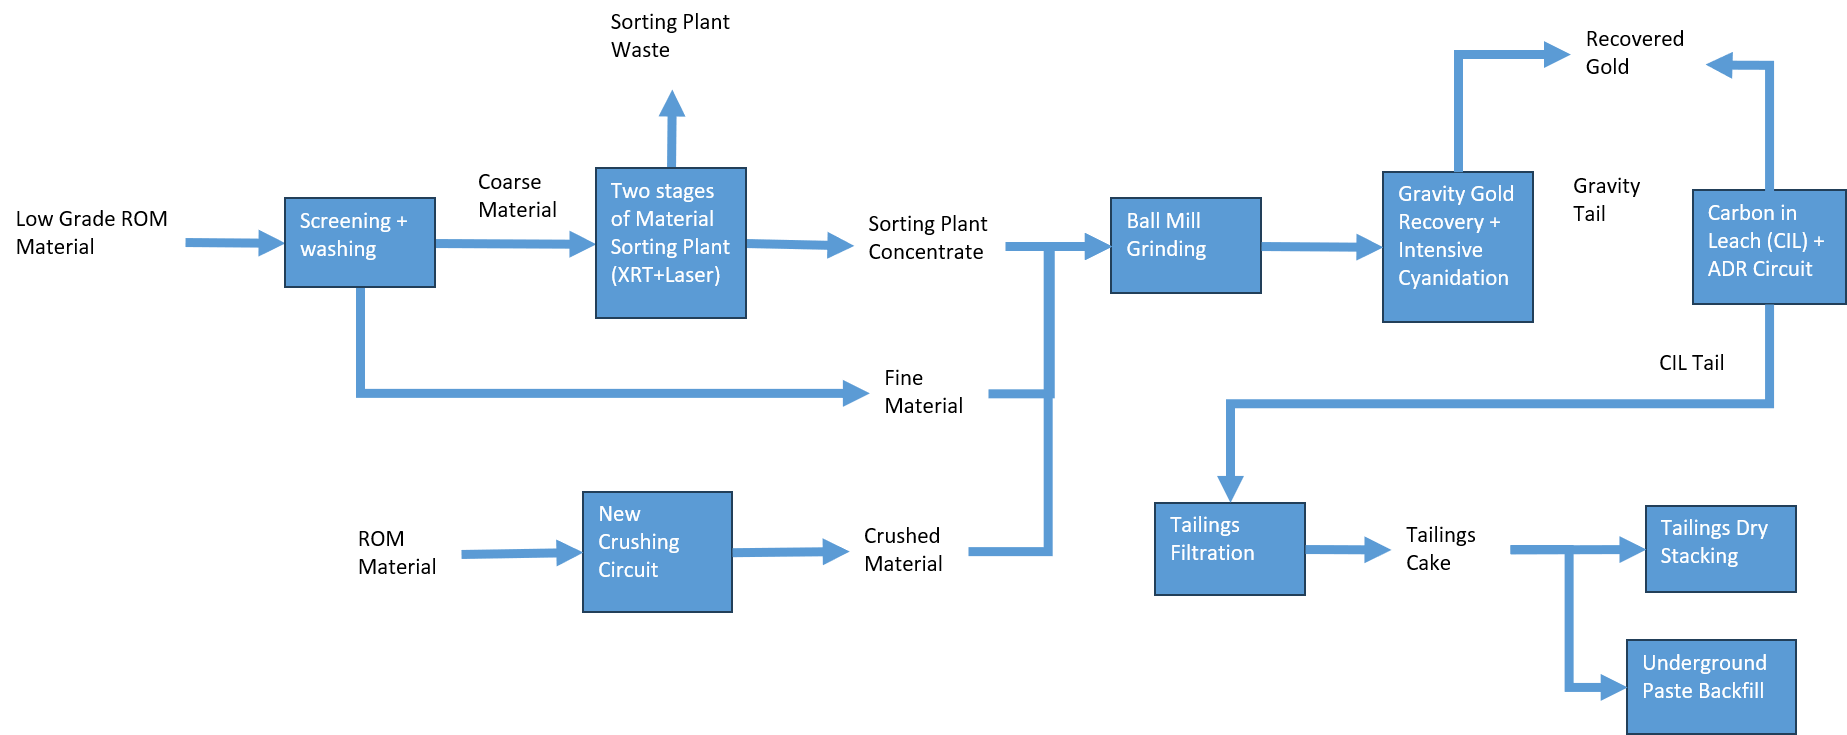
Figure 3: Bralorne Gold Project Process Block Flow Diagram
Project Infrastructure
Talisker intends on building on its existing infrastructure to expand production for the Project over the next four years. The new infrastructure required for the Bralorne Gold Project will include:
- 288 Room Camp
- Integrated Offices, Dry and First Aid/Training Facilities
- Processing Plant (Mill)
- Tailings filtration plant
- Dry Stack Site
- Water Treatment Plant
- Waste Rock Storage Area (WRSA)
- Water management structures
- Reclamation Material Stockpile (RMS)
- Haulage Roads and Site Roads
The all-season Highway 40 has been the main access to the site for decades. Typical highway delivery trucks will transport and deliver materials and equipment directly to the site as well as access for all site personnel.
The main infrastructure will be located at the current facilities site, while a new camp, offices, warehouse, maintenance shop, facilities, and laydown area will be located northeast of two planned waste rock storage areas and the Olympus Portal. The existing TSF site will be expanded southwest, and a dry stack site will be constructed.
Existing BC Hydro transmission line is planned to supply the Project with most of its power requirements while the balance will be provided by diesel generators.
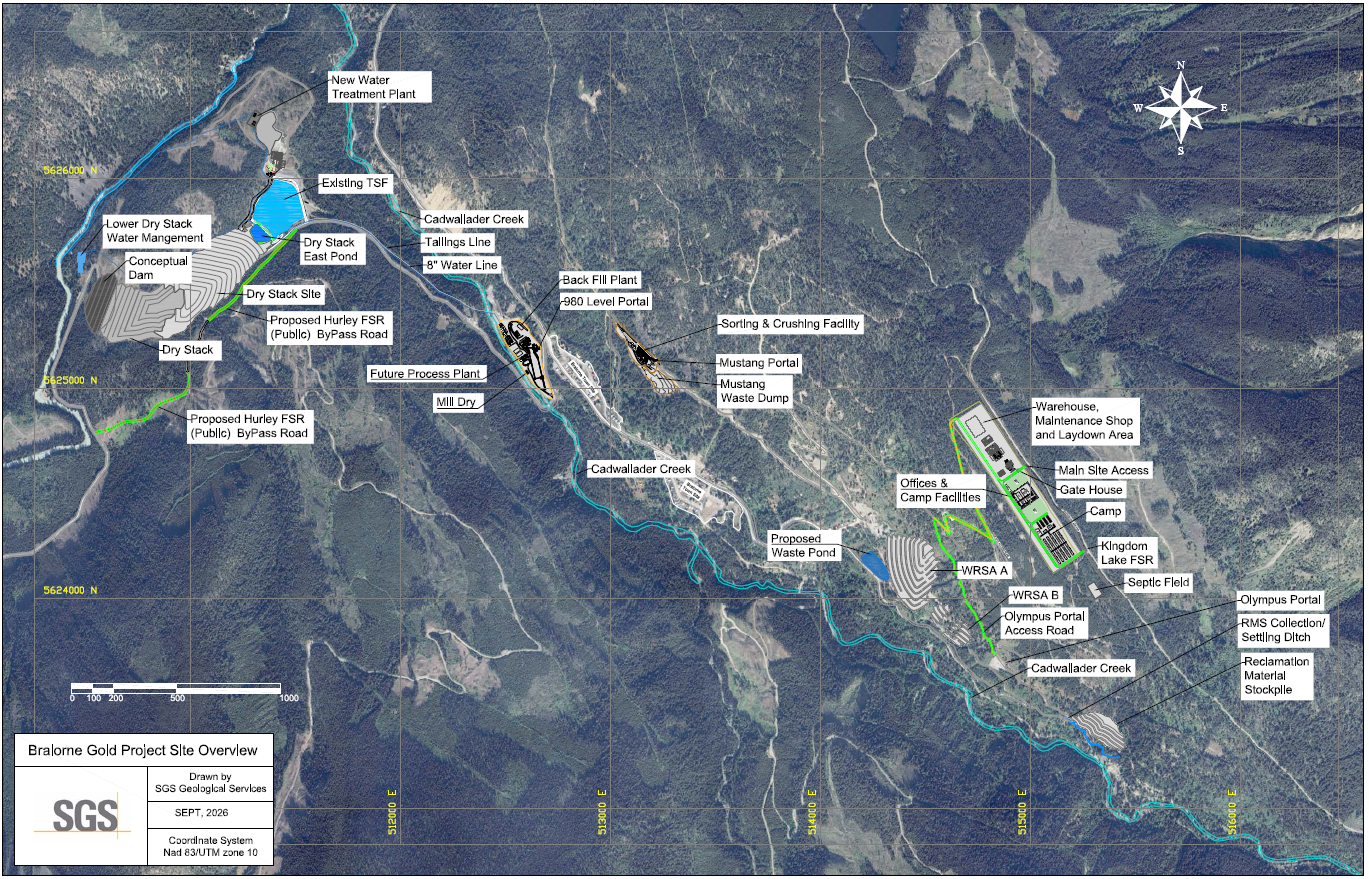
Figure 4: Proposed General Arrangement for the Bralorne Gold Project
Operating Costs
Life-of-mine operating costs for the Bralorne Gold Project are estimated at approximately C$2.96 billion, equivalent to an average unit operating cost of C$196.7/t mined and approximately US$1,470/oz of gold. Underground mining represents the largest component of operating costs at approximately C$1.84 billion, or 62.3% of total LOM operating costs, equivalent to C$122.5/t mined and approximately US$916/oz. General and administrative costs are estimated at C$638 million, followed by processing costs of C$366 million, sorting costs of C$68 million, and water treatment costs of C$44 million. The operating cost structure reflects the underground mining intensity of the Project while incorporating dedicated sorting and processing circuits designed to support the planned production profile.
Table 8: Bralorne Gold Project – Operating Costs
| Cost Area | Total LOM (C$M) |
Unit Cost ($/t mined) |
Unit Cost (US$/oz) |
% | |
| Underground mining | 1,844 | 122.5 | 916 | 62.3% | |
| Sorting | 68 | 4.5 | 34 | 2.3% | |
| Processing | 366 | 24.3 | 182 | 12.4% | |
| Water Treatment | 44 | 2.9 | 22 | 1.5% | |
| G&A | 638 | 42.4 | 317 | 21.5% | |
| Total site operating cost | 2,960 | 196.7 | 1,470 | 100.0% | |
Capital Costs
Total life-of-project capital expenditures for the Bralorne Gold Project are estimated at approximately C$1.23 billion, comprising C$416 million of initial capital, C$782 million of sustaining capital, and C$35 million of closure and reclamation costs. Initial capital is primarily associated with underground mining development and equipment financing at C$148 million, the process plant at C$86 million, surface infrastructure at C$37 million, and water and waste management infrastructure at C$29 million, together with C$50 million of construction indirects and C$65 million of contingency.
The sustaining capital, estimated at approximately C$782 million, is driven predominantly by ongoing underground mine development and equipment financing costs of C$661 million, with additional sustaining expenditures for the process plant, water and waste management, surface infrastructure, construction indirects, and contingency. C$35 million has also been included at the end of the project to account for closure and reclamation of the site.
Table 9: Bralorne Gold Project – Capital Costs
| Capital Area | Units | Initial Capital | Sustaining Capital | Total Capital |
| Mining | C$ million | 148 | 661 | 809 |
| Process plant | C$ million | 86 | 21 | 107 |
| Water and waste management | C$ million | 29 | 23 | 52 |
| Surface Infrastructure | C$ million | 37 | 36 | 73 |
| Construction Indirect | C$ million | 50 | 19 | 69 |
| Contingency1 | C$ million | 65 | 23 | 88 |
| Capital Costs | C$ million | 416 | 782 | 1,198 |
| Closure / reclamation | C$ million | 0 | 35 | 35 |
| Total Capital Costs | C$ million | 416 | 817 | 1,233 |
Note:
- Contingency of 35% was applied to capital cost for all items except the mining cost, which varies and has contingency included within.
Permitting and Environment
The existing Bralorne Gold Mine permit M-207, permitting underground mining up to 175 tpd and trucking offsite, is in place and currently followed for operations. A 750 tpd Bridge Application was submitted in July 2026 and is expected in January 2027. As part of the Bridge Application, the mine plan will allow for a five year operating horizon, and aligns with the timeline for the Mill and Mine expansion as outlined in the Study.
Separate from the Bridge Application, in July 2026, Talisker commenced planning for a Major Amendment Joint Application Permit Amendment process to amend its Mines Act Permit and Environmental Management Act permits related to air emissions and effluent discharge. The amendments are designed to facilitate production rates above 750 tpd and enable the construction of a milling facility as proposed in this Study.
Baseline environmental programs that will inform this application commenced in August 2026. Development of the permitting schedule is currently underway, with submission of the application targeted for late 2027. Cost related to the permitting efforts are included in the G&A for the PEA.
Community and Partner Engagement
The Bralorne Gold Project is located on the traditional lands of the St’át’imc Nation, which includes the N’Quatqua, Tsal’alh, Xwísten, T’itq’q’et (as represented by the P’egp’íg’lha Council) First Nation, and the Tŝilhqot’in National Government (TNG).
Talisker maintains open lines of communication with all Indigenous communities in the region and continues to prioritize building meaningful and progressive relationships and partnerships. Talisker commits to early and substantial engagement and believes that sharing true and clear engagement will demonstrate their respect for the communities and help build trust.
A Bridging Agreement was signed between Talisker and Xwísten on September 21, 2023 which outlines the relationship between the two parties and commits to working towards future agreements prior to commencement of mining above 750 tpd and on-site processing.
PEA Cautionary Statement
The PEA is preliminary in nature and includes Inferred Mineral Resources that are considered too speculative geologically to have the economic considerations applied to them that would enable them to be categorized as Mineral Reserves. There is no certainty that the results of the PEA will be realized. Mineral Resources that are not Mineral Reserves do not have demonstrated economic viability.
Technical Information and Qualified Persons
The Technical Report supersedes the 2026 MRE.
Reference should be made to the full Technical Report, prepared in accordance with NI 43-101 with an effective date of June 1, 2026. which be filed on SEDAR+ under Talisker’s profile within 45 days of the date of this press release.
The scientific and technical information contained in this news release has been reviewed and approved by Ben Eggers, MAIG, P.Geo., William van Breugel, P. Eng., Johnny Canosa, P. Eng., Henri Gouin, P. Eng. and Shaohai Yu, P. Eng, each an independent Qualified Person as defined under NI 43-101.
The Mineral Resource Estimate was prepared by Ben Eggers, MAIG, P.Geo. of SGS Geological Services. Mr. Eggers completed site visits to the Project on January 30-31, 2026 and August 20, 2026.
William van Breugel, P. Eng. Is an associate engineer of SGS Geological Services, having responsibility for the project economics including capital expenditures, operating expenditures, financials and sensitivities.
Johnny Canosa, P. Eng. of SGS Geological Services, having responsibility for the mining methods, infrastructure, and environment, permitting and social or community impact. Mr. Canosa completed a site visit to the Project on August 20, 2026.
Henri Gouin, P. Eng. of SGS Geological Services, having responsibility for the underground mining planning and schedule.
Shaohai Yu, P. Eng of SGS North America, having responsibility for the mineral processing, metallurgical testing and recovery methods.
About Talisker Resources Ltd.
Talisker (taliskerresources.com) is a junior resource company involved in the exploration and development of gold projects in British Columbia, Canada. Talisker’s flagship asset is the high-grade, fully permitted Bralorne Gold Project where the Company is producing at the Mustang Mine. Talisker projects also include the Ladner Gold Project, an historic high-grade gold mine near Hope, British Columbia, with significant exploration potential, and the Spences Bridge Project, where the Company has a significant landholding in the emerging Spences Bridge Gold Belt, as well as several other early-stage Greenfields projects.
For further information, please contact:
Lindsay Dunlop
Vice President, Investor Relations
lindsay.dunlop@taliskerresources.com
+1 647 274 8975
Caution Regarding Forward Looking Statements
Certain statements contained in this press release constitute forward-looking information. These statements relate to future events or future performance, including statements relating to the PEA, the 2026 MRE, Project economics, capital and operating costs, production rates, gold recovery, mine life, development schedules, permitting, project infrastructure requirements, community and partner engagement, financing, construction, future technical studies and the potential development of the Bralorne Gold Project. The use of words such as “could”, “intend”, “expect”, “believe”, “will”, “projected”, “estimated” and similar expressions is intended to identify forward-looking information. Such information is based on Talisker’s current expectations, assumptions and estimates, including certain key assumptions and the opinions and estimates of management and the authors of the Technical Report already discussed in this news release as well as expectations regarding gold and commodity prices, future exchange and interest rates; stable regulatory, permitting and political environments; the availability of financing, contractors, equipment, supplies and skilled labour; the accuracy of mineral resource estimates, Talisker’s ability to develop the Project on expected timeline and at expected costs, that expected grades and recovery rates will be realized and general economic and political conditions. Actual results may differ materially due to risks and uncertainties including changes in Project parameters, grade and recovery, commodity prices and the worldwide demand for and supply of minerals, risks related to increased competition and current global financial conditions, exchange rates, capital and operating costs, access to financing, capitalization and liquidity risks, reliance on key personnel, title, permitting, environmental matters, construction and operating risks, and other risks described in the Company’s public disclosure. The forward-looking information contained in this release is made as of the date hereof, and Talisker is not obligated to update or revise any forward-looking information, whether as a result of new information, future events or otherwise, except as required by applicable securities laws. Because of the risks, uncertainties and assumptions contained herein, investors should not place undue reliance on forward-looking information. The foregoing statements expressly qualify any forward-looking information contained herein.
1 Total cash cost and all-in sustaining cost (AISC) are non-GAAP financial measures. These measures have no standardized meaning under IFRS and may not be comparable to similar measures used by other issuers. As the Project has not yet achieved commercial production, it does not have historical non-IFRS financial measures nor historical comparable measures under IFRS and therefore these prospective non-IFRS financial measures may not be reconciled to the nearest comparable measure under IFRS.
Photos accompanying this announcement are available at:
https://www.globenewswire.com/NewsRoom/AttachmentNg/0d721278-792b-47ee-bba3-2ef5145b2b97
https://www.globenewswire.com/NewsRoom/AttachmentNg/cf449e12-ed0e-49e2-94ff-bae6a6dcdb28
https://www.globenewswire.com/NewsRoom/AttachmentNg/a1241c03-f8ae-4b73-a6c9-f51052c99850
https://www.globenewswire.com/NewsRoom/AttachmentNg/7b86ab45-25a9-4972-8f1d-c1e01f593f79